Choosing Water Treatment Equipment in 2026 requires more than comparing prices or browsing attractive product photos. A reliable decision begins with the water itself. Test the source for hardness, iron, chlorine, sediment, microbial risks, and seasonal changes. A private well may produce orange staining after heavy rain, while a municipal supply may create a chlorine taste in a kitchen glass. These details shape the correct treatment method.
Capacity matters just as much. A family of four, a hotel, and a small factory rarely need the same system. Check peak flow, daily consumption, inlet pressure, drain access, electrical requirements, and available installation space. A filter that performs well in a showroom can fail when several showers run together. That mistake is common.
Look beyond the equipment cabinet. Ask for verified performance data, independent laboratory results, warranty terms, replacement-part availability, and clear maintenance instructions. Certifications such as NSF/ANSI standards may support safer purchasing decisions, but certification alone does not guarantee suitability for every water source. Local professionals can interpret test results and confirm installation conditions.
Some assumptions will be wrong.
A low purchase price may conceal frequent cartridge changes, complex servicing, or high energy use. Conversely, the most advanced system may be unnecessary for mildly hard water. This guide considers treatment goals, operating costs, monitoring needs, and long-term reliability. It also recognizes an uncomfortable truth: water quality can change, and equipment decisions may need review after installation. Careful testing, documented maintenance, and realistic expectations create a stronger basis for choosing equipment in 2026.
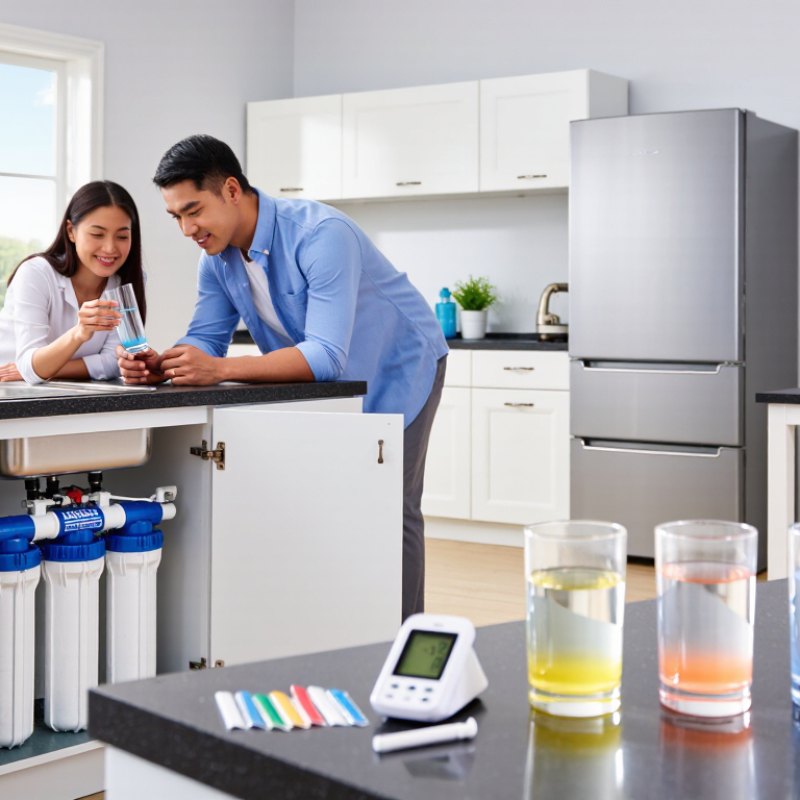
Define water quality goals before comparing treatment equipment. A clear target prevents expensive overdesign and unsafe shortcuts. The WHO Guidelines for Drinking-water Quality recommend risk-based planning from the source through the tap. Test raw water at different seasons, not only once. Measure turbidity, pH, hardness, conductivity, microbial indicators, and relevant chemicals. Local contaminants may matter more than generic product specifications.
The WHO/UNICEF Joint Monitoring Programme reported that 2.2 billion people lacked safely managed drinking water in 2022. This figure shows why “clean-looking” water is not a sufficient goal. Treatment requirements should state acceptable limits, flow rate, daily volume, and monitoring frequency. For irrigation or industrial reuse, include salinity, nutrients, and process-specific contaminants. The 2024 UNESCO World Water Development Report notes that agriculture accounts for about 70% of global freshwater withdrawals, making efficient reuse increasingly important.
A practical design links each contaminant to a verified process. Suspended solids may need clarification or filtration. Dissolved salts require a different approach. Microbial control also needs measurable residual protection or validated disinfection. Equipment capacity must match peak demand, not the average alone. It is easy to miss maintenance water, seasonal changes, or sudden source contamination. A neat specification can still be wrong. Recheck the assumptions. Independent laboratory testing and documented performance data provide stronger evidence than brochures, while final limits must follow the applicable local regulations.

Match the treatment process to the contaminant, not the equipment catalogue. Start with laboratory testing at the source and at the point of use. The US EPA’s 2024 PFAS rule set limits of 4 nanograms per liter for PFOA and PFOS. Granular activated carbon, ion exchange, and reverse osmosis can reduce PFAS, but performance depends on competing chemicals, flow rate, and contact time. These details are easy to overlook.
For arsenic, dissolved iron, or manganese, adsorption and oxidation-filtration may work better than ordinary sediment filters. The WHO Guidelines for Drinking-water Quality recommend an arsenic guideline value of 10 micrograms per liter.
Nitrate requires a different approach. Reverse osmosis or biological treatment may be suitable, while carbon filtration generally is not. Hardness calls for ion exchange or membrane treatment. Disinfection targets microbes, not metals. One device rarely solves everything.
Tips:
Test seasonal changes, not one sample only. Check pressure loss, reject water, media replacement, and operator skills before purchasing. Ask for contaminant-specific performance data under conditions close to yours. A certified test report is useful, but it is not a guarantee for every installation. Real systems age unevenly. Filters clog sooner than expected, and users sometimes skip maintenance. That uncomfortable gap should shape the equipment choice.
How to Choose Water Treatment Equipment in 2026?
Capacity should match real demand, not an optimistic average. The UN World Water Development Report 2024 projects global water demand may rise 20–30% by 2050. Measure average, peak, and seasonal flows before selecting equipment. Clarifiers suit high suspended-solids loads, while membrane systems provide stronger dissolved-contaminant removal. However, membranes need tighter pretreatment and regular cleaning. Small systems often favor modular units, while large facilities need redundancy and automated control.
Operating conditions can change the decision quickly. Test pH, temperature, salinity, turbidity, hardness, and contaminant concentration on site. High salinity may require reverse osmosis, but low temperature can reduce membrane output. Biological systems can lower organic pollution efficiently, yet unstable temperatures may weaken treatment performance. Disinfection systems also need verified contact time and consistent flow. WHO drinking-water guidance emphasizes risk-based control from source to final delivery, rather than relying on one treatment barrier.
Energy deserves careful comparison. The International Energy Agency identifies water and wastewater services as significant electricity users, especially where pumping and advanced treatment are required. Ask for energy use per cubic metre, chemical consumption, recovery rate, and maintenance hours. Do not trust a laboratory result alone. Real sites are messier. A design with 20% spare capacity may still fail during shock loads, while excessive capacity increases capital and operating costs. Pilot testing is often imperfect, but it can reveal fouling, pressure loss, and cleaning frequency before installation.
| Equipment Type | Primary Treatment Purpose | Typical Capacity Range | Typical Feed-Water Conditions | Typical Removal or Performance | Operating Conditions | Key Selection Considerations |
|---|---|---|---|---|---|---|
| Coarse Screen or Bar Screen | Removal of rags, plastics, leaves, and large suspended solids | 10–10,000 m³/h | Raw surface water, municipal wastewater, or industrial influent containing large debris | Physical separation of particles typically larger than 3–100 mm, depending on screen spacing | Low pressure requirement; requires regular screening and debris disposal | Select opening size, cleaning method, peak-flow capacity, corrosion resistance, and bypass protection |
| Multimedia Filter | Reduction of turbidity, suspended solids, and some particulate organic matter | 1–500 m³/h per vessel or skid | Usually pretreated water with moderate turbidity and limited oil or grease | Often reduces turbidity to below 1–5 NTU when properly designed and operated | Filtration rate commonly about 5–15 m/h; periodic backwashing is required | Check loading rate, backwash-water availability, media depth, pressure loss, and inlet-water variability |
| Activated Carbon Filter | Reduction of chlorine, taste, odor, and many dissolved organic compounds | 0.5–300 m³/h per vessel or skid | Low-turbidity water with limited suspended solids and controlled microbial activity | Performance depends strongly on carbon type, empty-bed contact time, and target contaminants | Typical empty-bed contact time is about 5–20 minutes; carbon requires monitoring and replacement or reactivation | Evaluate contaminant concentration, breakthrough risk, carbon life, backwash needs, and biological growth potential |
| Water Softener | Removal of calcium and magnesium hardness to reduce scaling | 0.5–250 m³/h | Hard water with stable chemistry and low suspended-solids loading | Can reduce hardness substantially when resin capacity, brine strength, and regeneration are correctly controlled | Ion exchange; requires salt or regenerant, rinse water, and periodic regeneration | Consider hardness level, sodium limits, flow peaks, regeneration frequency, wastewater discharge, and iron fouling |
| Ultrafiltration (UF) | Removal of suspended solids, colloids, bacteria, and many viruses | 1–1,000 m³/h per system | Surface water, wastewater, or seawater after suitable pretreatment; excessive oil can damage membranes | Typical membrane pore-equivalent range is approximately 0.01–0.1 micrometres; high turbidity and microbes are reduced | Operating pressure commonly about 0.5–5 bar; requires backwash and periodic chemically enhanced cleaning | Check feed turbidity, algae, oil, temperature, recovery, membrane material, cleaning chemicals, and automation level |
| Nanofiltration (NF) | Partial softening and reduction of color, organic matter, and multivalent ions | 1–500 m³/h per system | Well-pretreated water with controlled suspended solids and scaling potential | Often provides high removal of hardness and multivalent ions, with lower removal of monovalent salts than RO | Operating pressure commonly about 5–25 bar; concentrate management is required | Assess target ion removal, osmotic pressure, antiscalant needs, recovery, energy use, and concentrate disposal |
| Reverse Osmosis (RO) | Desalination and reduction of dissolved salts, metals, nitrate, and many dissolved contaminants | 0.1–10,000 m³/day per system | Low-turbidity, dechlorinated, scale-controlled feed water after pretreatment | Commonly removes approximately 95–99% of many dissolved salts, subject to membrane and water chemistry | Typical pressure is about 10–20 bar for brackish water and 55–80 bar for seawater; produces concentrate | Evaluate feed TDS, temperature, recovery target, scaling, pretreatment, energy, membrane cleaning, and reject-water disposal |
| Ultraviolet (UV) Disinfection | Inactivation of bacteria, viruses, and protozoa without adding a chemical residual | 0.1–5,000 m³/h | Low-turbidity water with adequate UV transmittance and limited color | Common design doses range from about 30–60 mJ/cm², depending on the required pathogen reduction | Requires lamp monitoring, quartz-sleeve cleaning, stable flow, and reliable electrical power | Confirm UV transmittance, target organisms, dose validation, lamp replacement interval, and downstream recontamination risk |
| Chlorination System | Disinfection and maintenance of a residual disinfectant in distribution systems | 0.1–10,000 m³/h | Water with manageable turbidity and known chlorine demand | Effectiveness depends on disinfectant dose, contact time, pH, temperature, and organic load | Requires chemical storage, dosing control, mixing, contact time, and residual monitoring | Consider pH, bromide, disinfection by-products, chemical safety, contact-tank volume, and residual targets |
| Electrodeionization (EDI) | Continuous polishing of RO permeate for low-conductivity process water | 0.1–100 m³/h per module or system | RO permeate with low hardness, low carbon dioxide, and low organic contamination | Can produce high-purity water, but final quality depends on feed conductivity and carbon-dioxide control | Uses electricity and ion-selective membranes; typically operates continuously without routine chemical regeneration | Best suited to stable RO permeate; assess conductivity, silica, carbon dioxide, hardness, flow balance, and pretreatment quality |
| Dissolved Air Flotation (DAF) | Removal of suspended solids, algae, fats, oils, and grease | 5–1,500 m³/h | Water containing low-density solids or emulsified materials that are difficult to settle | Performance depends on coagulation, flocculation, recycle ratio, and particle characteristics | Uses pressurized recycle water and air; chemical conditioning is often required | Check surface loading rate, sludge characteristics, chemical demand, air-solids ratio, and peak-flow response |
Evaluate Installation, Maintenance, Safety, and Compliance Needs
A reliable water treatment system begins with the installation site, not the product brochure. Measure doorway widths, ceiling height, drainage access, and electrical capacity before selecting equipment. Leave enough clearance for filter changes and inspection panels. A crowded plant room creates avoidable maintenance risks.
Ask who will operate the system each day. Controls should show pressure, flow, dosing rates, and alarm status clearly. Maintenance staff need safe access, readable manuals, spare parts, and practical cleaning procedures. Record backwash cycles, chemical use, membrane condition, and unexpected shutdowns. Small records often reveal large problems.
Safety must be designed into the equipment. Provide bunding around chemical tanks, ventilation near dosing points, emergency eyewash stations, and suitable protective equipment. Confirm isolation points before servicing pumps or electrical components. Do not assume automatic controls remove human risk. They do not.
Compliance requirements vary by location, water source, discharge route, and intended use. Ask a qualified engineer to verify permits, testing frequencies, material suitability, and electrical requirements. Use an accredited laboratory when independent water analysis is required. Keep calibration certificates and service reports together. That paperwork matters.
A lower purchase price can hide difficult maintenance. I have seen systems selected for capacity alone, then underused because operators found them confusing. Recheck the decision with the people who will clean, monitor, and repair the equipment. Their objections may be inconvenient, but they are often accurate.
How to Choose Water Treatment Equipment in 2026?
Choosing water treatment equipment requires more than comparing purchase prices. The lowest quote may become expensive after installation, energy use, chemical consumption, maintenance, and downtime are included. Calculate the total cost over the equipment’s expected operating life. Ask for realistic figures based on your water quality, flow rate, operating hours, and local utility prices.
I once reviewed a system that looked affordable on paper. Its pumps used more electricity than expected, and filter replacements arrived slowly. The initial saving disappeared within two years. That experience changed my evaluation process. I now examine cleaning intervals, replacement part availability, labor requirements, and control system reliability. Small details matter. A five-minute daily task can become costly across a full year.
Long-term performance also depends on correct sizing and regular monitoring. Request test data from water conditions similar to yours, not only ideal laboratory results. Check whether the system maintains output quality during peak demand and seasonal changes. Review service records, operator training, warranty limits, and expected component life. Independent testing can reveal weaknesses before installation. However, no forecast is perfect. Water chemistry may change, and projected savings may prove too optimistic. Leave room in the budget for testing, repairs, and upgrades. A durable system should remain understandable to operators, not merely impressive in a sales proposal.
Select equipment based on total cost and long-term performance
This indicative comparison uses a 10-year planning horizon for a mid-size water treatment application. Total cost includes equipment purchase, installation, routine maintenance, consumables, replacement parts, and electricity. The performance score reflects contaminant removal capability, operational stability, automation potential, and expected service life. Actual results vary with water quality, flow rate, operating pressure, energy prices, and replacement schedules.
